Microsoft Azure: Learning Sentinel (8/30/24):

Monitoring RDP Events with Microsoft Sentinel on Azure
In this project, I set up a comprehensive system to monitor Remote Desktop Protocol (RDP) events using Microsoft Sentinel and Azure resources. Below, I outline the steps I took to achieve this:
- Create a Microsoft Azure Account
I started by creating an Azure account, which is essential for setting up and managing Azure resources. - Create a Virtual Machine
To monitor RDP events, I created a virtual machine (VM) on Azure. This VM will serve as the target for monitoring traffic on port 3389, the default port for RDP. - Add Microsoft Sentinel to a Workspace
I added Microsoft Sentinel to my Azure workspace. Sentinel is a powerful tool for analyzing and responding to security threats. - Intentionally Leave RDP Open
For monitoring purposes, I intentionally left RDP open on the VM. This allowed me to capture and analyze traffic on port 3389 effectively. - Configure Event Logs and Send to Log Analytics Workspace
I configured the VM to send its event logs to a Log Analytics workspace. From there, these logs are forwarded to Microsoft Sentinel for further analysis. - Set Up Data Connector
I used a data connector to integrate the VM’s event logs with Microsoft Sentinel. This step ensures that data from the VM is correctly ingested and available for analysis. - Select Windows Security Events via Azure Monitoring Agent (AMA)
I configured the Azure Monitoring Agent (AMA) to collect Windows security events. This setup allows for comprehensive monitoring of security-related activities on the VM. - Create a Data Collection Rule
I created a data collection rule to capture all security events from the selected VM. This rule ensures that all relevant security data is collected and sent to Sentinel. - Wait for Logs to be Collected
I allowed some time for the logs to be collected and ingested into the Log Analytics workspace and Sentinel. - Create a Sentinel Rule for RDP Sign-Ins
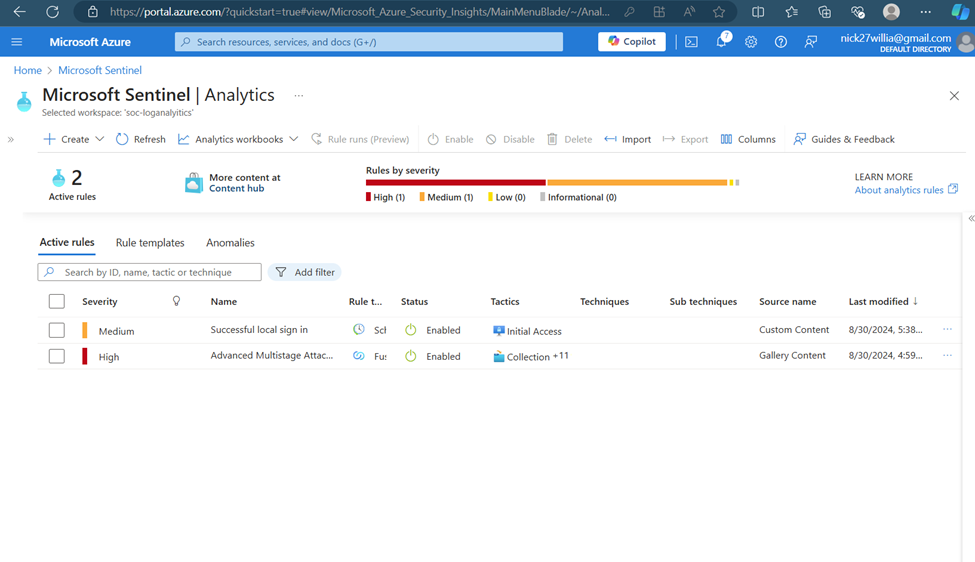
I created a Sentinel rule to specifically check for successful local sign-ins via RDP. This custom rule helps in identifying and analyzing RDP access events. - Verify the Rule in Analytics
Once the rule was created, it appeared in the Sentinel analytics dashboard. This step confirmed that the rule was correctly configured and active. - Monitor Incidents on the Dashboard
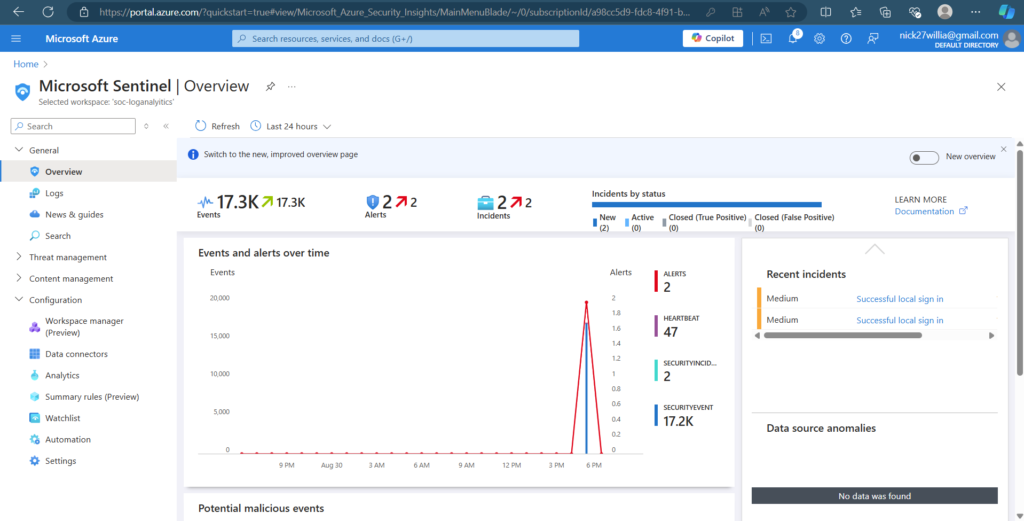
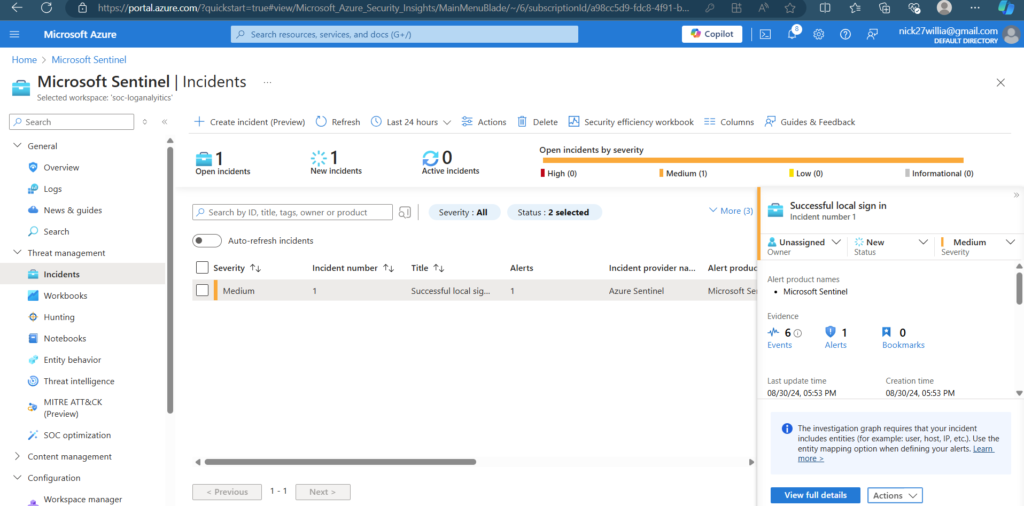
After signing in via RDP, an incident was generated and appeared on the main Sentinel dashboard. This indicates that the monitoring and alerting system is functioning as intended. - Review Security Events
With the setup complete, I can now view and analyze security events that are ingested into the Sentinel platform, providing valuable insights into RDP access and other security activities on the VM.
Analytics Rules: A screenshot showing the analytics rules configured in Microsoft Sentinel.

Incident Capture: An image of an incident captured by Sentinel based on RDP sign-ins.

Overview Dashboard: A snapshot of the Sentinel overview dashboard displaying the collected data and alerts.
